
Project Description
Project overview
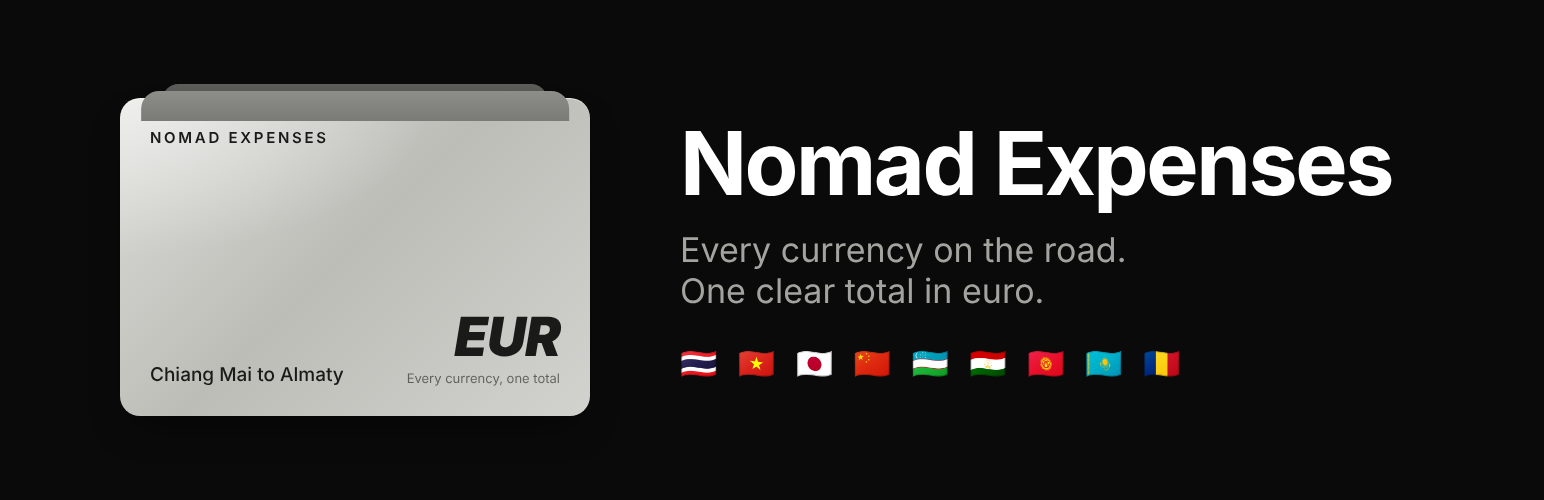
Nomad Expenses is a mobile-first travel expense tracker for long trips across many countries. You log an expense in the currency you paid, in about 3 taps. The app converts it to euro at the exchange rate for that day, then shows what the whole trip has cost by category, by month, by country and by trip leg.
I built it for my own journey: 9 months on the road through 9 countries, from Chiang Mai to Almaty, starting in December 2026. That means 9 local currencies plus flights and bookings charged in euro or dollars. A spreadsheet stops being practical on day 3 of a trip like that. The well-known budgeting apps want an account, a subscription and my spending data on their servers. So I built a small private web app that I host myself, with one password, one database and no tracking.
The project sits closest to SaaS development and custom Next.js product engineering. It follows the same approach as NomadWealth, my self-hosted net worth app: the owner keeps the data and the product stays small enough to deploy in minutes.
The challenge
Every new currency makes one simple question harder to answer: what has this trip cost so far? The app had to answer it from data entered in seconds, on a phone, often on a slow connection, without sending that data to anybody else.
Logging a 320 baht dinner has to be quicker than putting the phone away. Anything slower gets skipped. A tracker with gaps is worthless after a month.
Exchange rates move every day. A total that is recalculated at the current rate changes every time you open the app, so past spending has to stay fixed.
Spending data says where you are and what you do. It had to live in my own database, with no analytics, no trackers and no third party accounts.
The app is used at a market stall or in the back of a taxi. It needed large touch targets, almost no typing and pages that load on weak mobile data.
What was delivered
I designed and built the whole product: the data model, the currency conversion, the 4 screens, the card interface, the read-only share view and the deployment. The first version shipped as a working app that anybody can deploy to their own Vercel account in under 5 minutes.
The trip leg and the currency follow the date. An expense dated 5 December picks Thailand and Thai baht on its own, so a typical entry is an amount, a category and save.
The exchange rate is looked up for the day of the expense and stored next to it. Old totals stay exactly as they were when rates move.
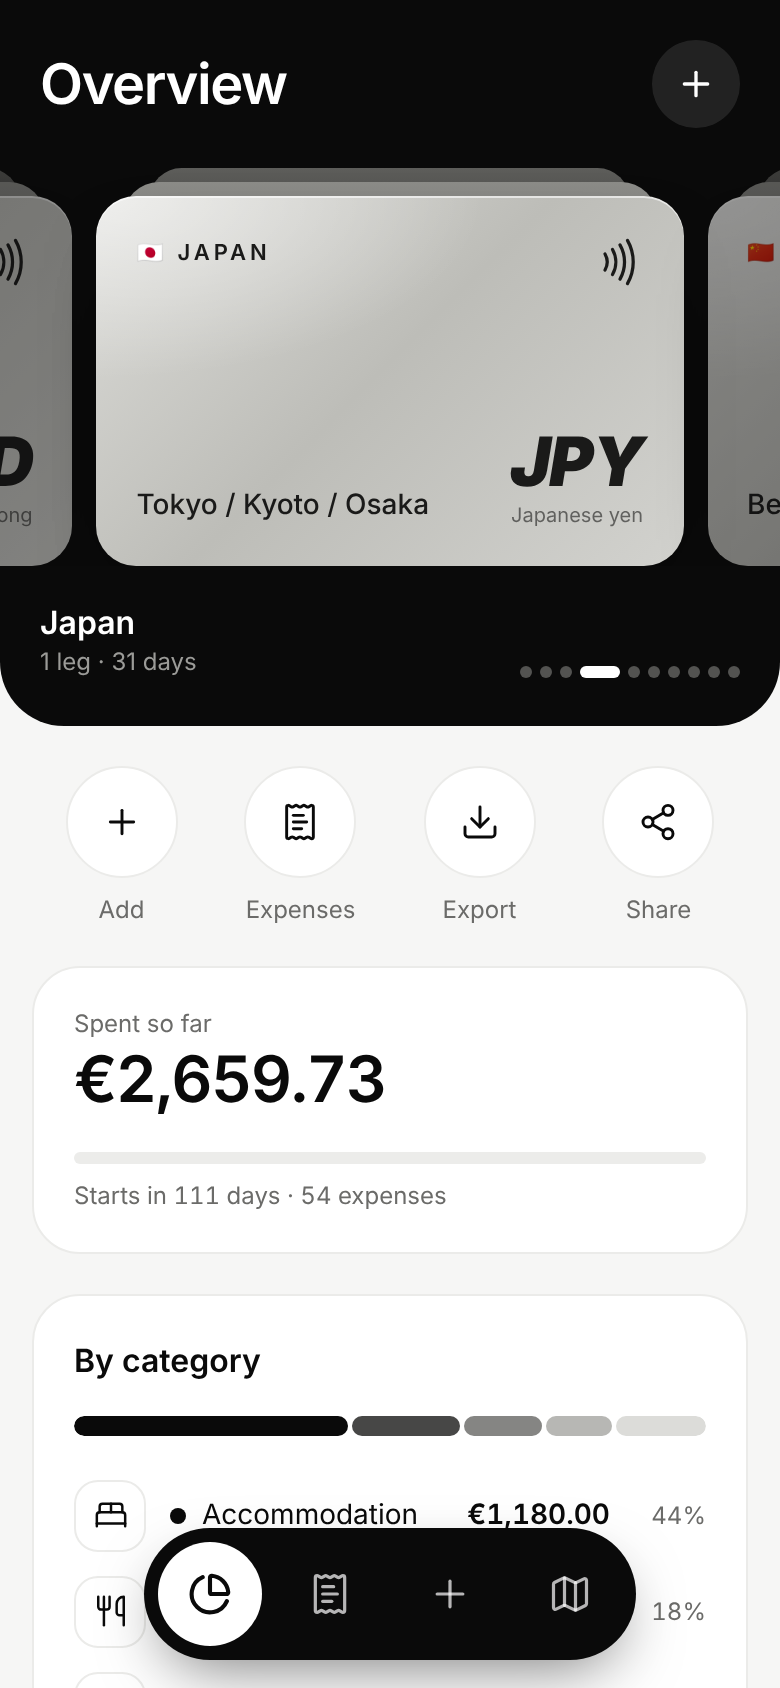
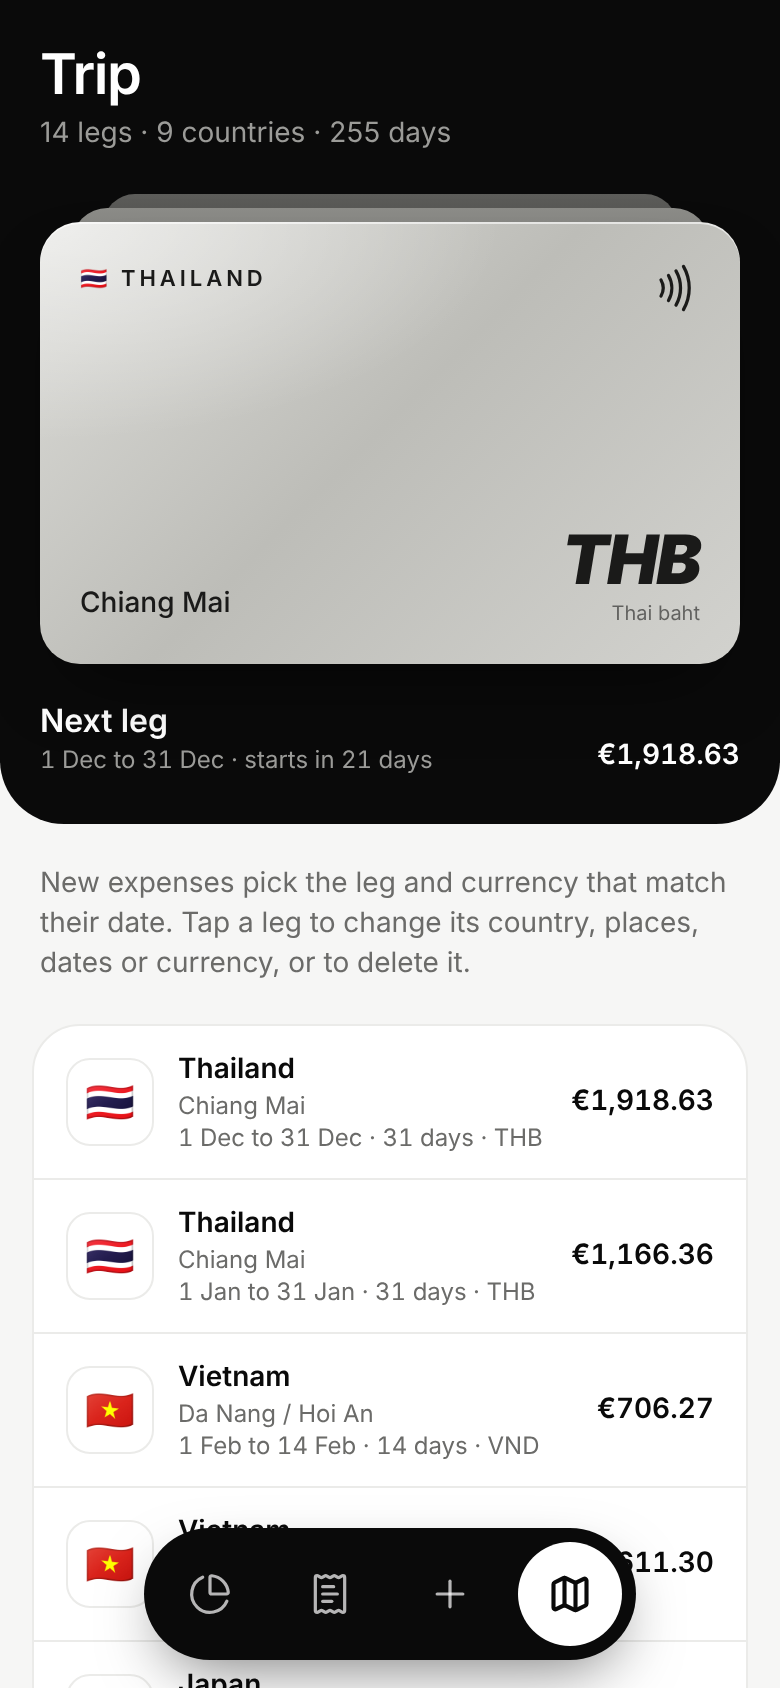
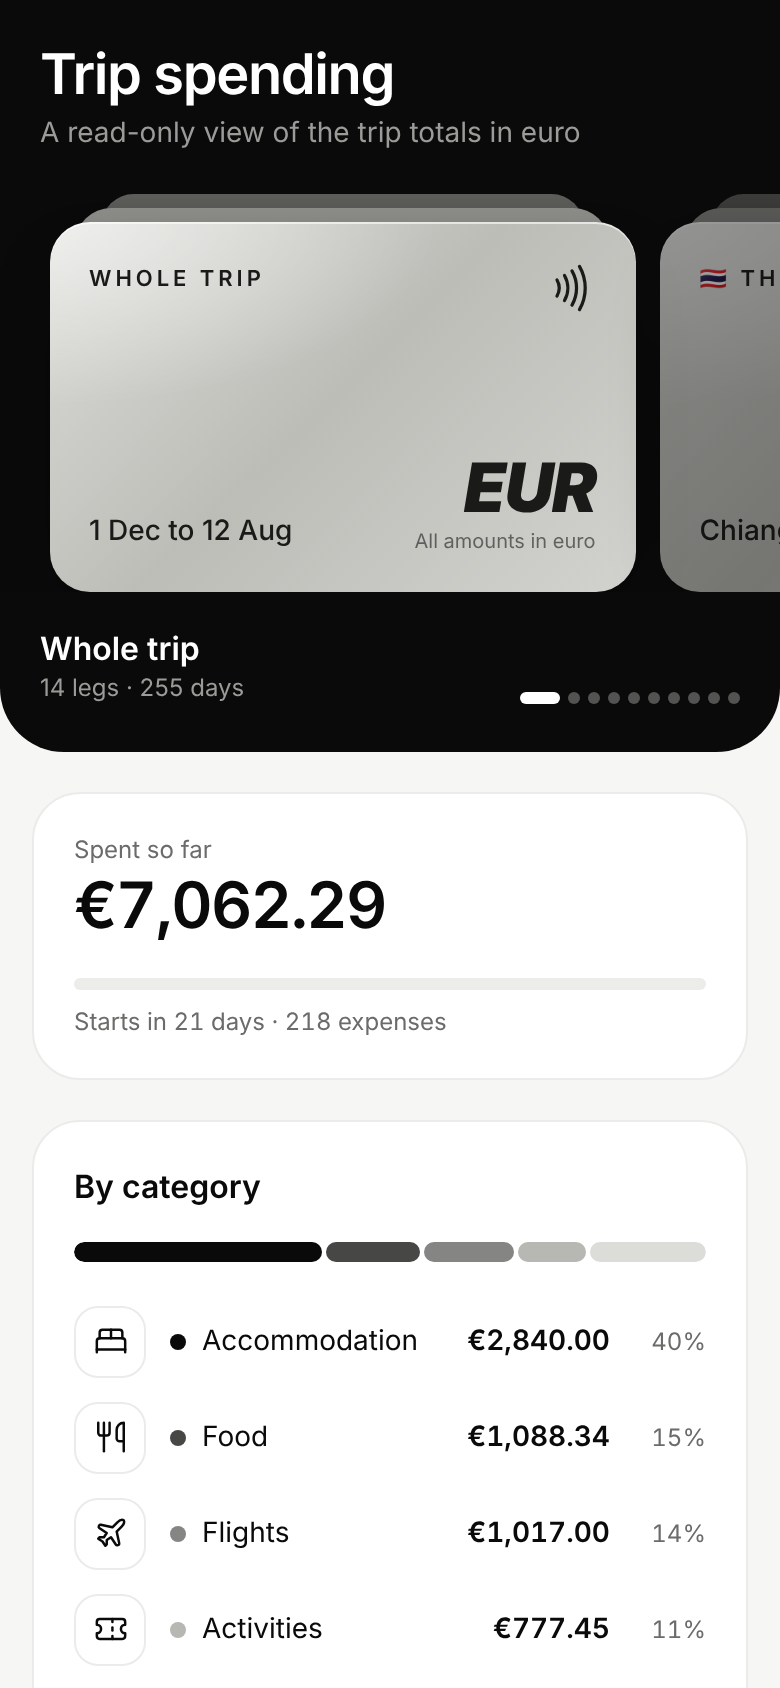
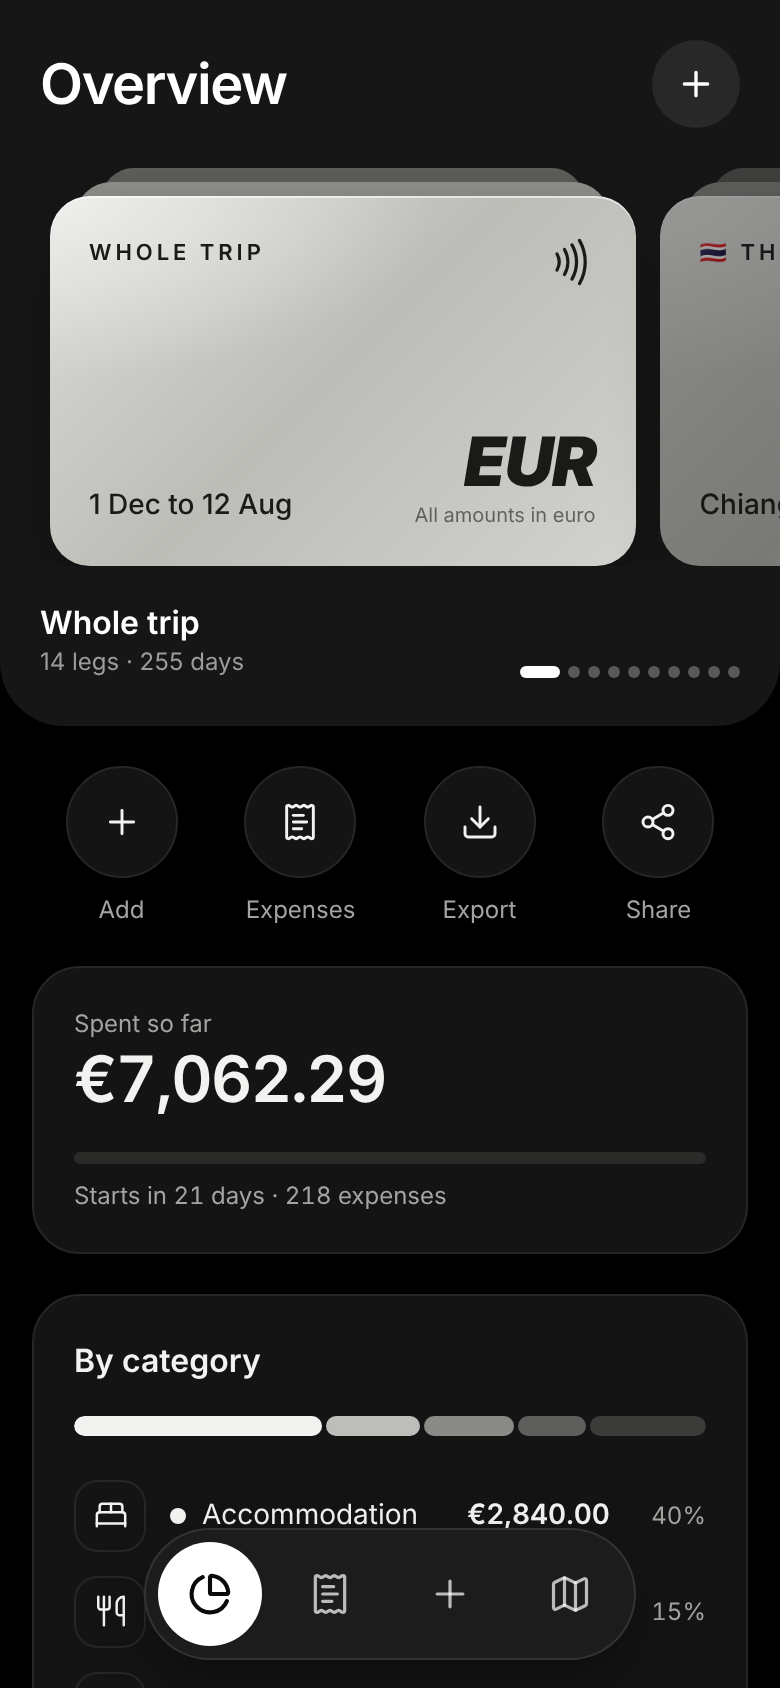
A silver card for the whole trip and one for each country. Swipe between them and every number below follows the card in front.
Database tables and the full itinerary are created during the first build. There is no terminal, no migration command and no setup screen.
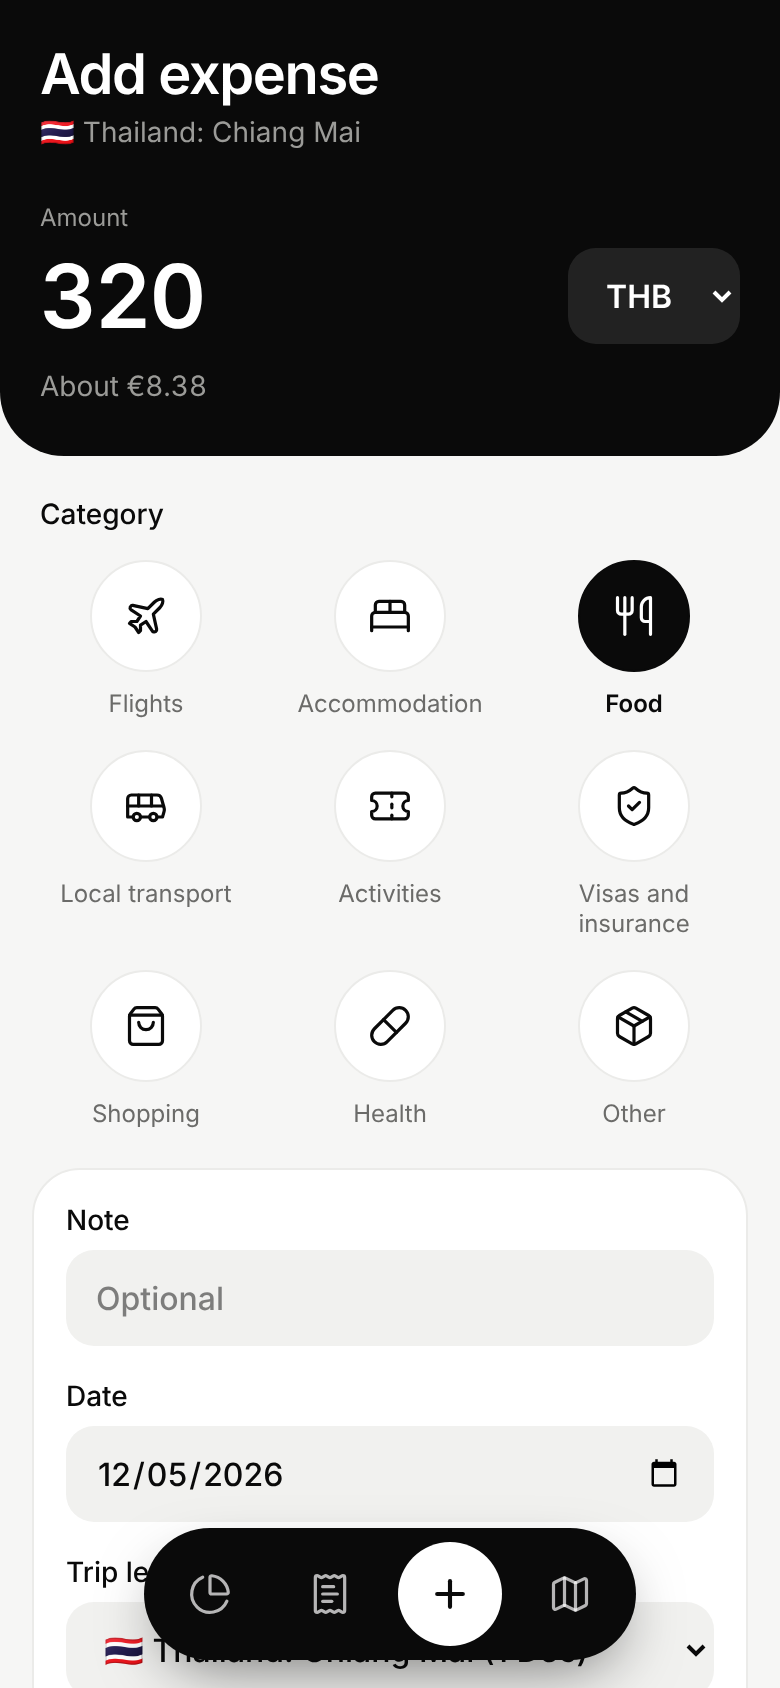
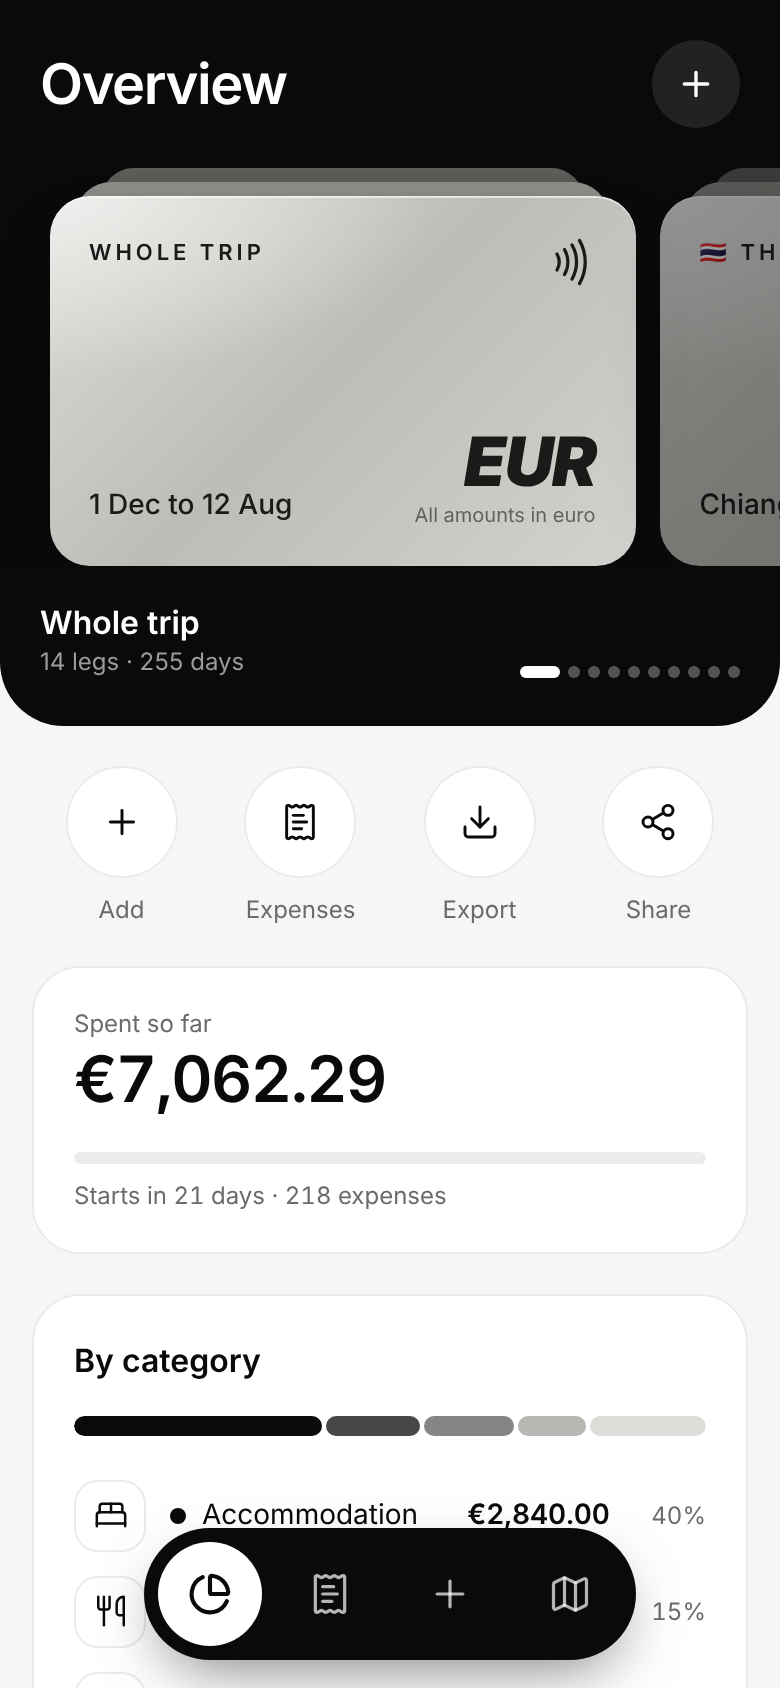
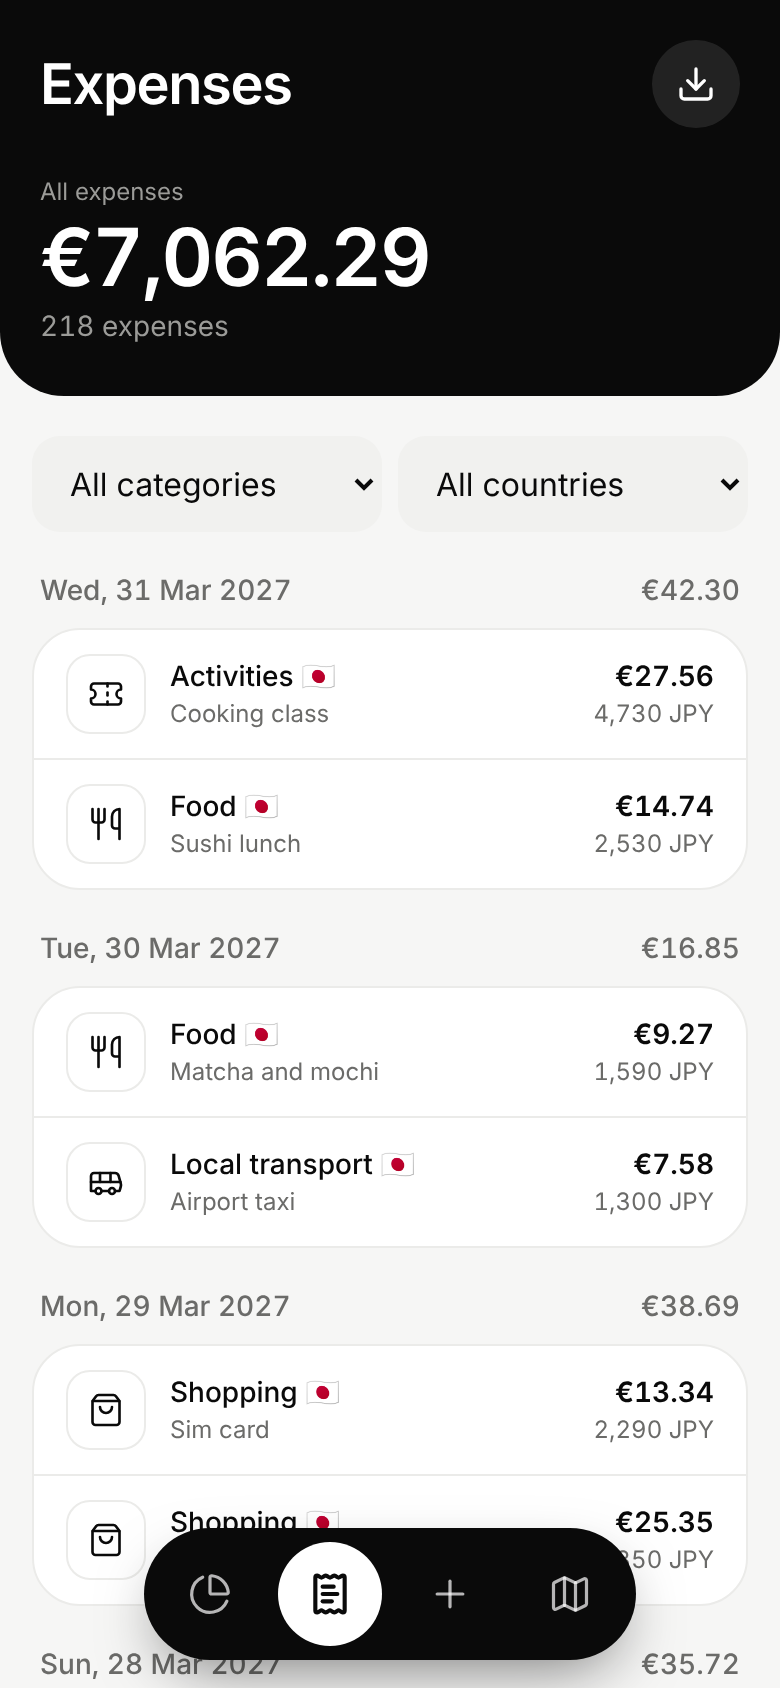
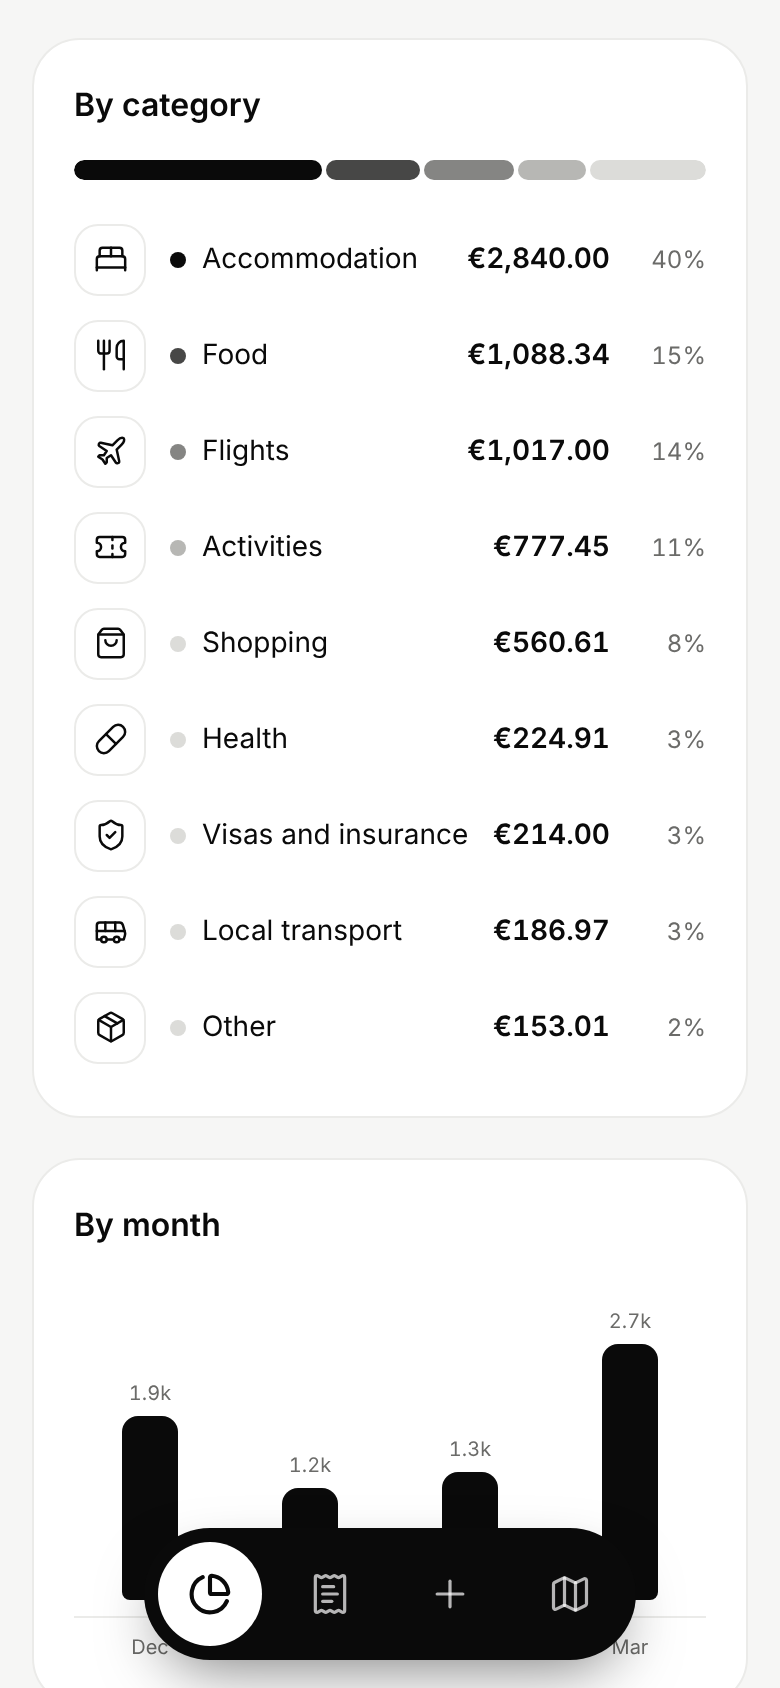
The amounts in these screenshots are sample data.
Core functionality included
3 taps for a typical expense across 9 categories: flights, accommodation, food, local transport, activities, visas and insurance, shopping, health and other. A live euro preview updates while you type.
Euro, dollar, Romanian leu, Thai baht, Vietnamese dong, Japanese yen, Chinese yuan, Uzbek som, Tajik somoni, Kyrgyz som and Kazakh tenge. Any expense can use another currency, because flights are often charged in euro or dollars.
3 free exchange rate sources are tried in turn and none of them needs a key. With no signal or no rate you type your own. You can switch back to the looked-up rate at any time.
Expenses are grouped by day with a daily total. Filter by category and by country, then tap any row to edit or delete it. Each row shows the amount paid and its value in euro.
A segmented bar with the share of each category, spending over time by month and a cost per day for every country and every trip leg.
All 14 legs of the trip load on the first build. Change the country, places, dates or default currency when plans move. New legs get a flag and a suggested currency from a list of more than 160.
Create a link for family or friends that opens the trip totals without a password. It shows totals only. Single expenses, notes and the export stay private. Any link can be switched off.
One file with every expense: date, country, places, category, note, amount paid, currency, rate and amount in euro. It opens directly in Excel, Numbers and Google Sheets.
Add it to a phone home screen and it opens full screen with its own icon, a floating navigation bar and light and dark modes that follow the phone setting.
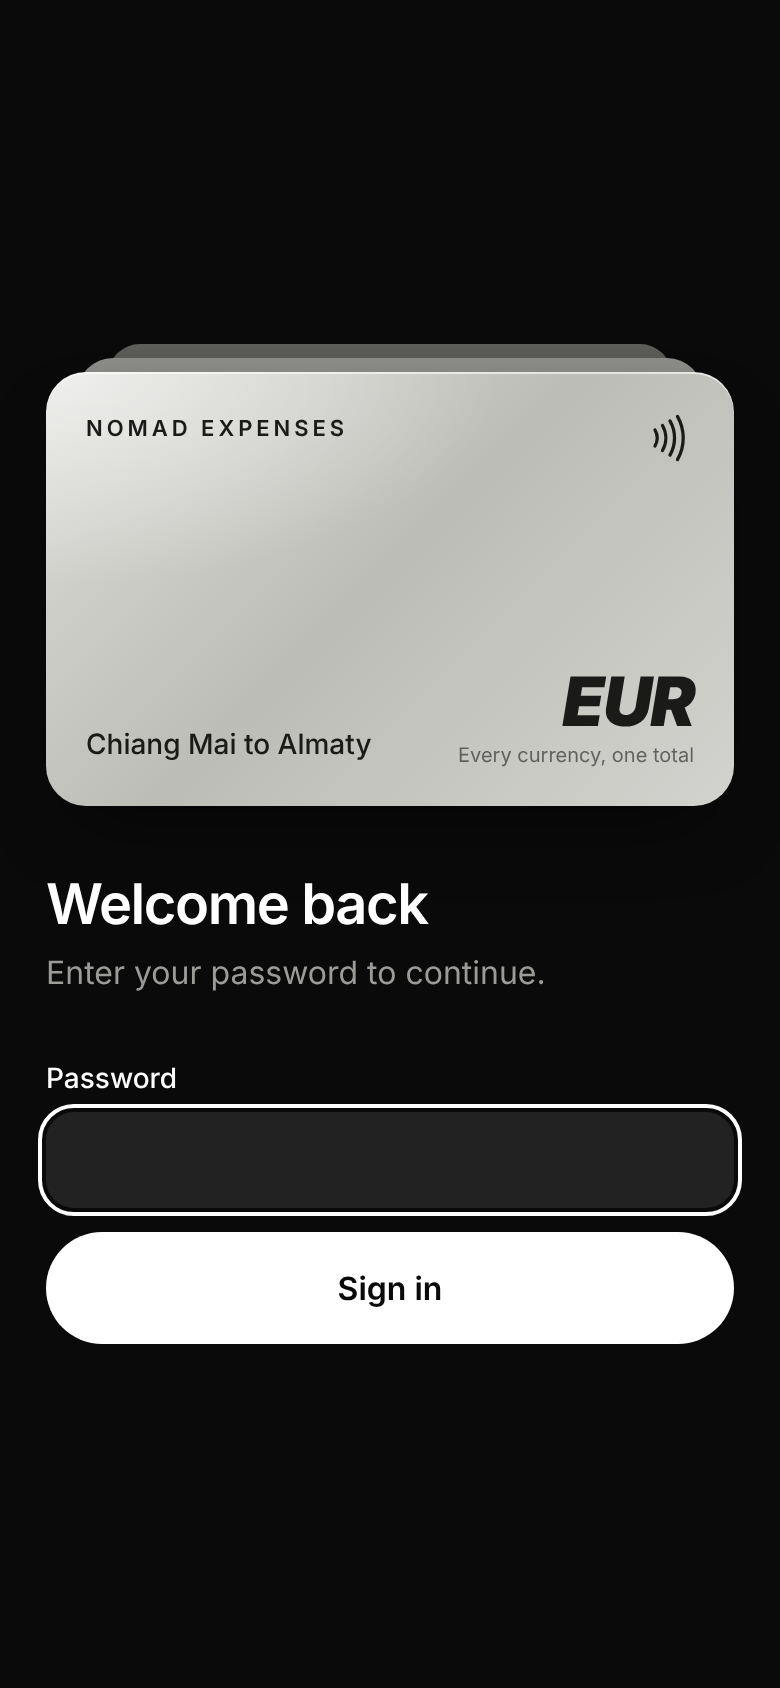
One password protects every page and every data route. There are no analytics and no trackers. Search engines are told not to index the app.
Key architecture decisions
The guiding rule was to keep the product small. It has one user, one password and one database, so every feature that a multi-user product would need was left out on purpose. 4 decisions did most of the work.
Each expense stores the amount paid, the currency, the rate for that day and the value in euro. Totals are simple sums of stored values, so they load quickly and never change after the fact.
The build command applies the database migrations and loads the itinerary into an empty database. A fresh deployment needs no manual database step. A schema change ships with the next deployment.
The bars and breakdowns are ordinary markup with styles. There is no chart library to download on a slow connection in the Fann Mountains.
A single password check sits in front of every page and every data route. The only exception is a share link, which carries a long random token and opens a view with totals only.
The exchange rate lookup carries a currency and a date and nothing about the person asking. The first 2 sources keep daily history, so an expense entered a week late still gets the rate for the day it happened. The third source only knows the latest rate and acts as the last fallback.
Results and outcomes
The result is a finished, installable travel expense tracker that answers the question it was built for. Open the overview and the cost of the trip is there in euro, for the whole journey or for a single country, built from entries that take seconds to make.
Amount, category and save. The date picks the country and the currency, so there is almost nothing to type.
Every expense is converted at the rate for its own day and stored, so the euro total is stable and easy to trust.
Import the repository on Vercel, add a Postgres database, set one password and deploy. The first build creates the tables and loads all 14 legs.
Everything lives in the owner’s own Postgres database. The spreadsheet export means the data can leave at any time.
Family can follow the trip totals through a read-only link without seeing a single expense or note.
No chart library, no analytics scripts and no third party accounts keep the pages small on weak mobile data.
Technology used
Nomad Expenses is built with Next.js 16 and the App Router, React 19 and TypeScript, styled with Tailwind CSS 4 in a monochrome card design with Lucide line icons. Data access uses Drizzle on a Neon Postgres database, with server actions for sign in, expenses, legs and share links. Exchange rates come from the fawazahmed0 currency data set through 2 delivery networks, with open.er-api.com as the last fallback. The app deploys to Vercel and installs on a phone home screen through a web app manifest.
The delivery is most relevant to SaaS development, mobile-first web apps and custom development where speed and privacy matter more than a long feature list.
Next steps
This case study covers the first version, built before the trip begins. The roadmap comes from the route itself: offline entry that syncs when a connection returns, for the Fann Mountains and Song-Kul, then budgets for each leg and category with the remaining amount, then receipt photos attached to an expense.
If you need a small focused web app, an internal tool or a first version of a product that people can use on a phone, the most relevant starting point is SaaS development. You can also tell me what you are building and I will recommend the next practical step.